
What The People Who Live Longest Have In Common
|
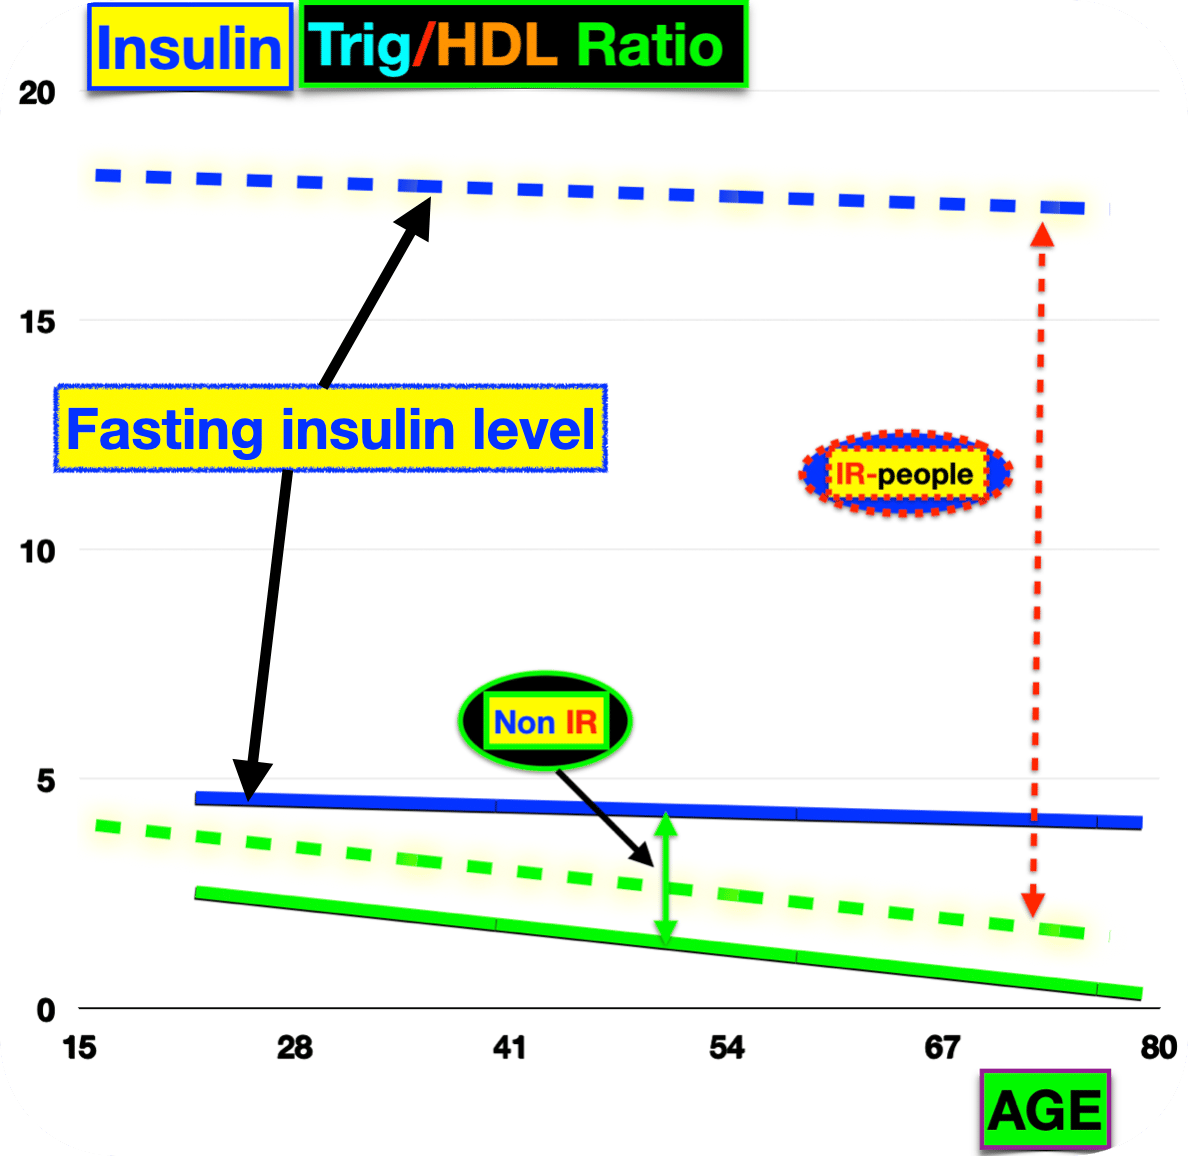
Hey Reader, Dr Karl here. It shows up in the data, and it’s the opposite of what most people track. When I plot my clients by age, something shows up that I didn’t go looking for. The older people in my data — the ones still healthy, still going — have a much lower fasting insulin. Not lower cholesterol. Not lower weight, particularly.
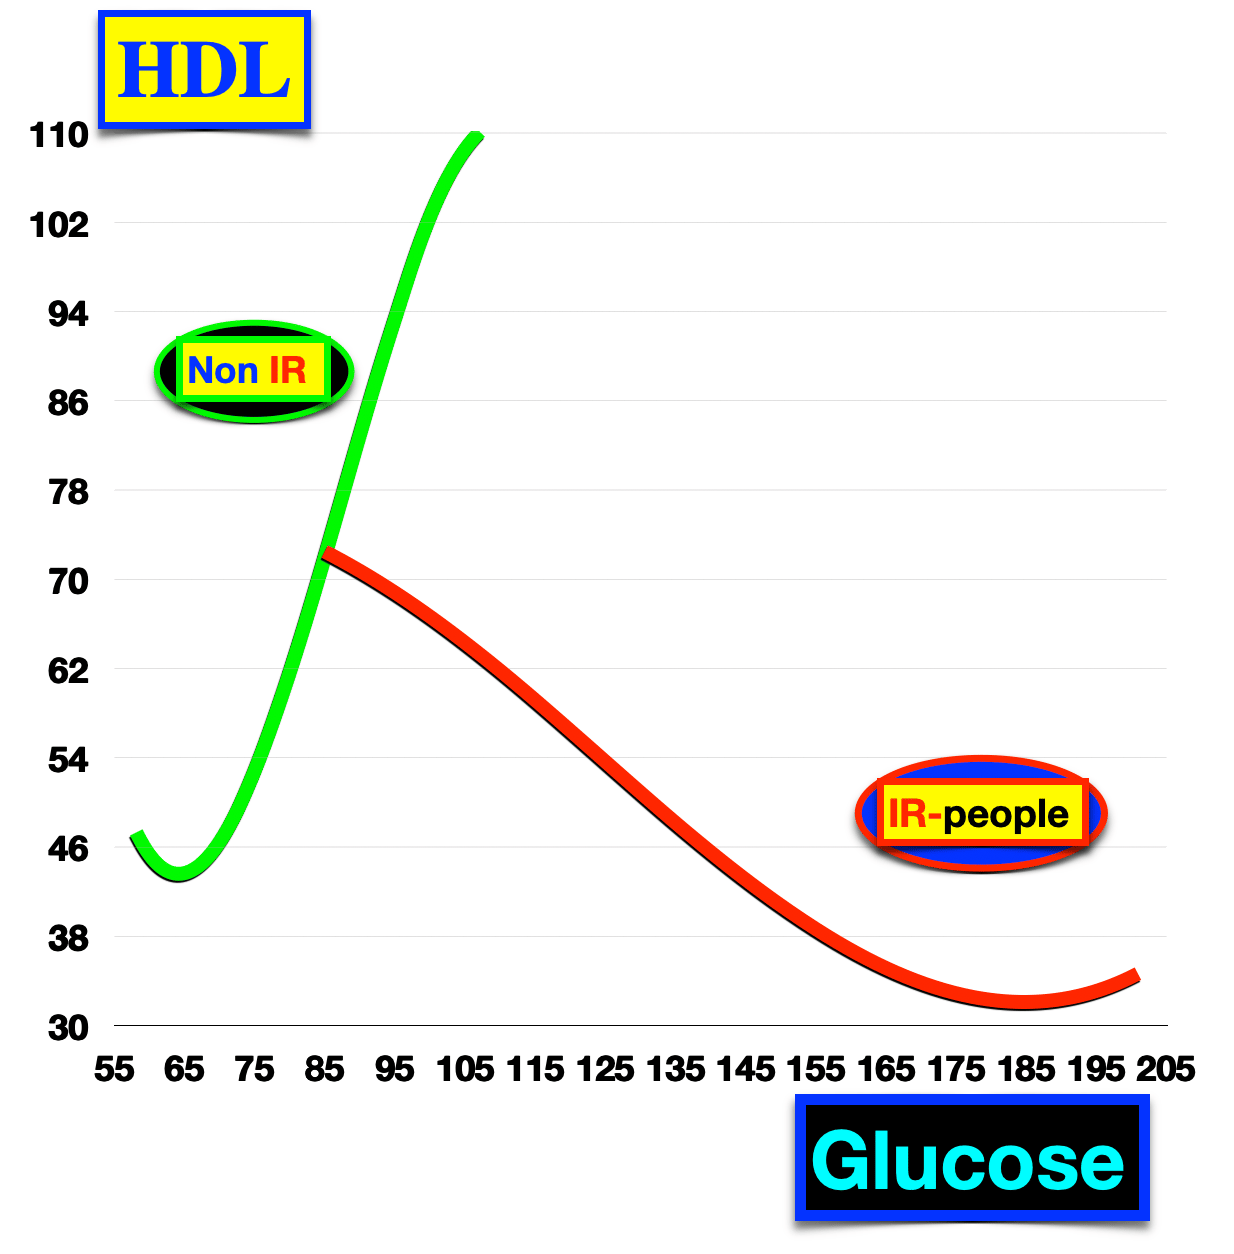
Lower insulin. The same pattern shows up in the triglyceride-to-HDL ratio: it drops with age among the people doing well. Now, I want to be careful about what that does and doesn’t prove. This is my cohort, not a controlled trial, and there’s an obvious question underneath it: did that healthy 80-year-old always have those numbers, or did they earn them along the way? I can’t answer that from a snapshot. But here’s what I’d say to a 15-year-old sitting high on that chart, and to anyone else reading this: if your numbers are up there, they need to come down if you plan on a long healthy life. That’s not a threat. It’s just what the data looks like. And the practical part is simpler than people expect. Look at the relationship between fasting glucose and HDL. If your glucose is high, your HDL is almost always correspondingly low.
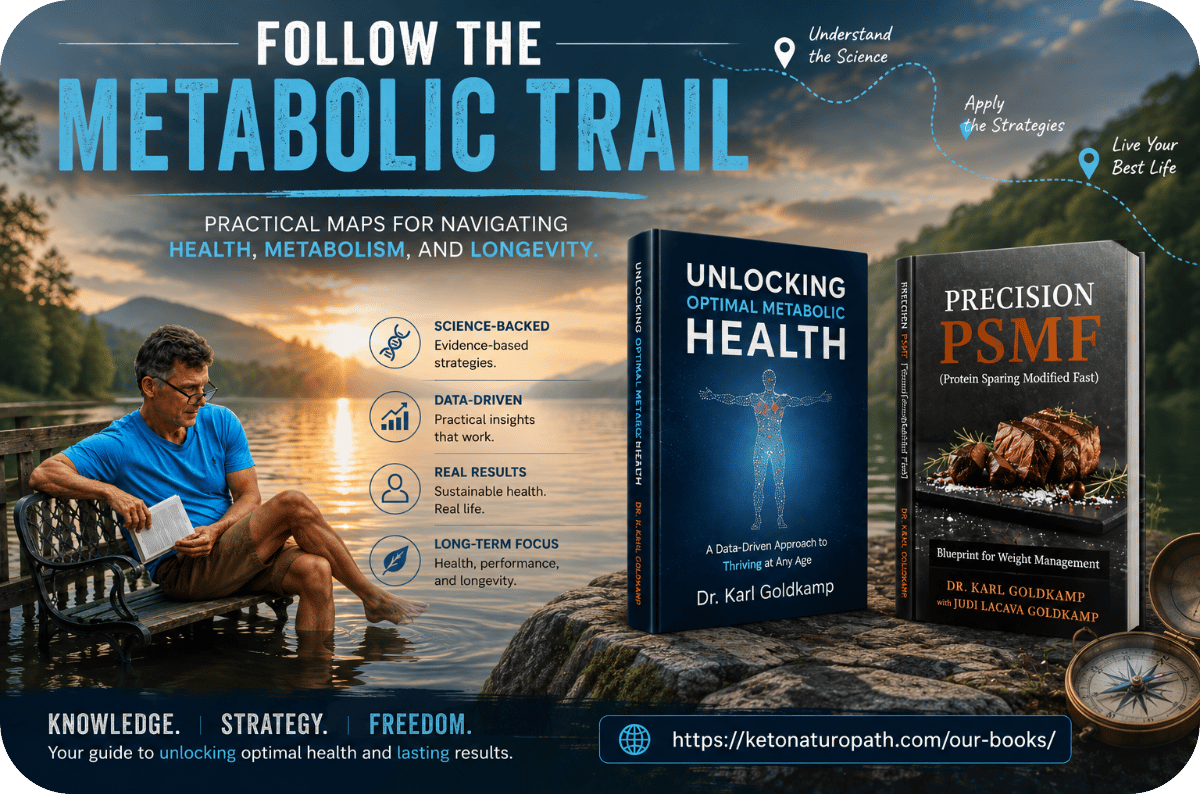
So what happens if you stop chasing the glucose directly and focus on raising the HDL instead — mainly through whole-food animal protein: meat, poultry, fish? Your fasting glucose tends to come down on its own. You’ve addressed the upstream problem instead of arguing with the downstream number. That’s what I mean when I say the pattern tells you what to do. One number tells you that you have a problem. The relationship between two numbers tells you where to push. The graphs are in the video: To your health, Dr. Goldkamp That’s the whole reason I wrote Unlocking Optimal Metabolic Health: A Data-Driven Approach to Thriving at Any Age — to show you how to read your own labs, see the patterns, and act on real data instead of generic reference ranges. 📗 Grab the book Here: website
|
Free
Three numbers your doctor called normal
Four pages on three pairs of numbers you have almost certainly had run already: glucose with insulin, triglycerides with HDL, homocysteine with B12 and folate. Read one at a time, each one comes back normal. Read as pairs, they say something else.
Or if you would rather talk it through, the 20-minute call is free. I will tell you on the call if this is not a fit.
Follow Me


Recent Posts
Archives
- October 2026
- September 2026
- August 2026
- July 2026
- June 2026
- May 2026
- April 2026
- March 2026
- February 2026
- January 2026
- December 2025
- November 2025
- October 2025
- September 2025
- August 2025
- July 2025
- June 2025
- May 2025
- April 2025
- March 2025
- February 2025
- January 2025
- December 2024
- November 2024
- October 2024
- September 2024
- August 2024
- July 2024
- June 2024
- May 2024
- April 2024
- March 2024
- February 2024
- January 2024
- December 2023
- November 2023
- October 2023
- September 2023
- August 2023
- July 2023
- June 2023
- May 2023
- April 2023
- March 2023
- February 2023
- January 2023
- December 2022
- November 2022
- October 2022
- September 2022
- August 2022
- July 2022
- June 2022
- May 2022
- April 2022
- March 2022
- February 2022
- January 2022
- December 2021
- November 2021
- October 2021
- September 2021
- August 2021
- July 2021
- June 2021
- May 2021
- April 2021
- March 2021
- February 2021
- January 2021
- December 2020
- November 2020
- October 2020
- September 2020
- August 2020
- July 2020
- June 2020
- May 2020
- April 2020
- March 2020
- February 2020
- January 2020
- December 2019
- November 2019
- October 2019
- September 2019
- August 2019
- July 2019
- June 2019
- May 2019
- April 2019
- March 2019
- February 2019
- January 2019
- December 2018
- November 2018
- October 2018
- September 2018
- August 2018
- July 2018
- June 2018
- May 2018
- April 2018
- March 2018