
Her A1c wasn’t measuring her glucose. It was measuring her red cells.
|
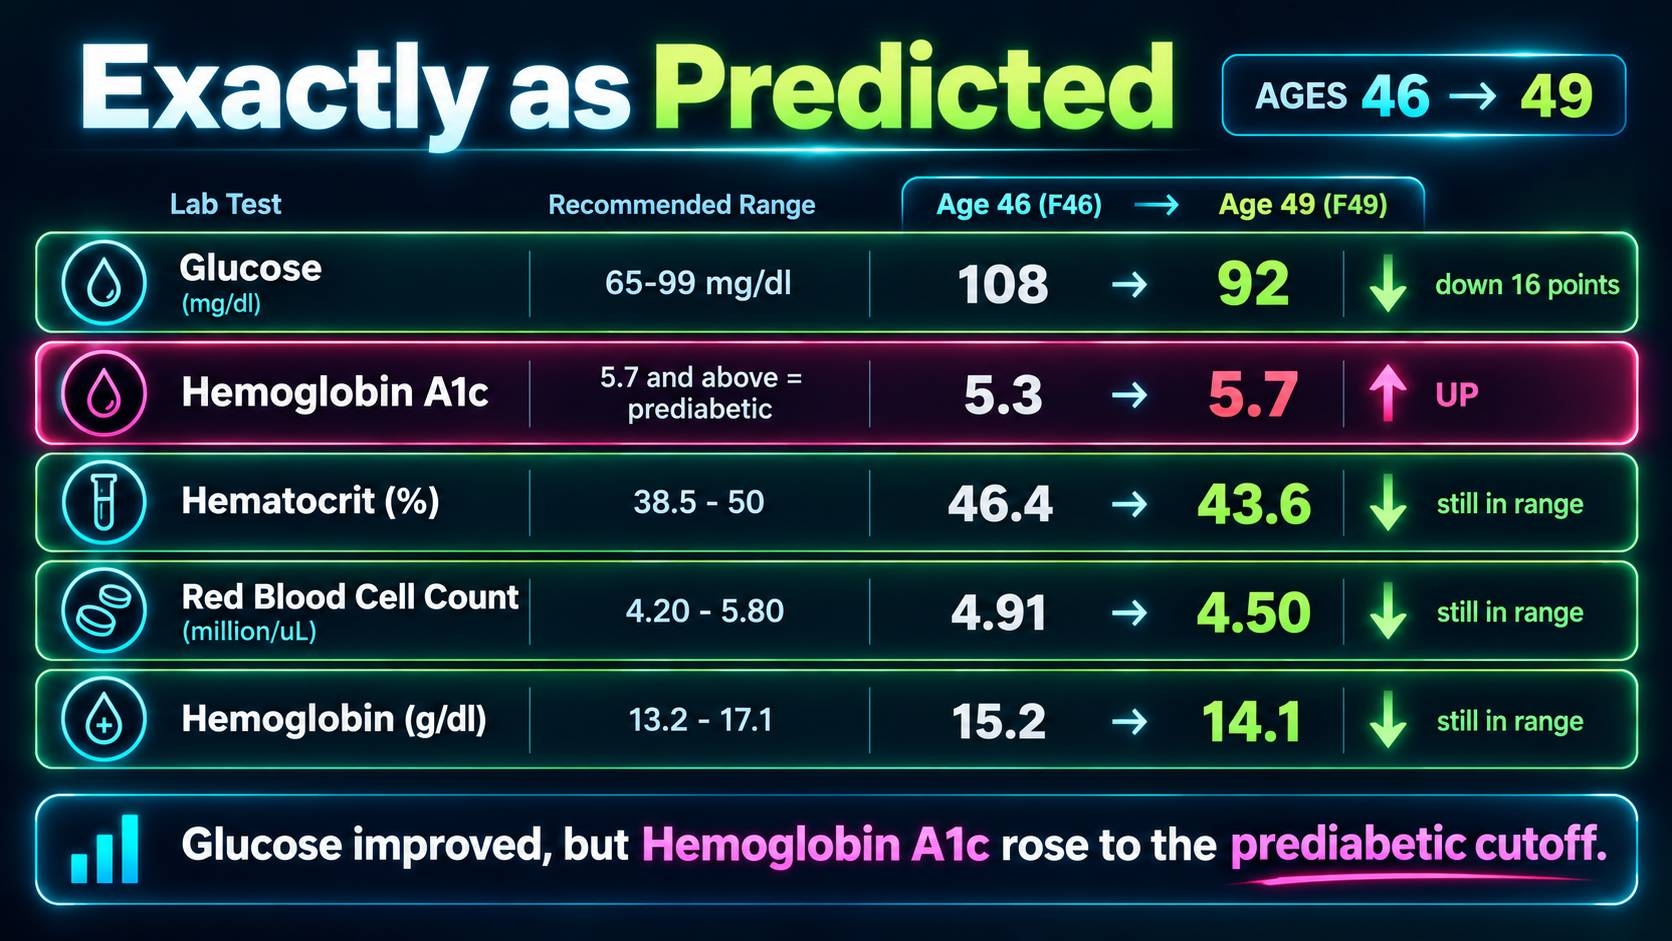
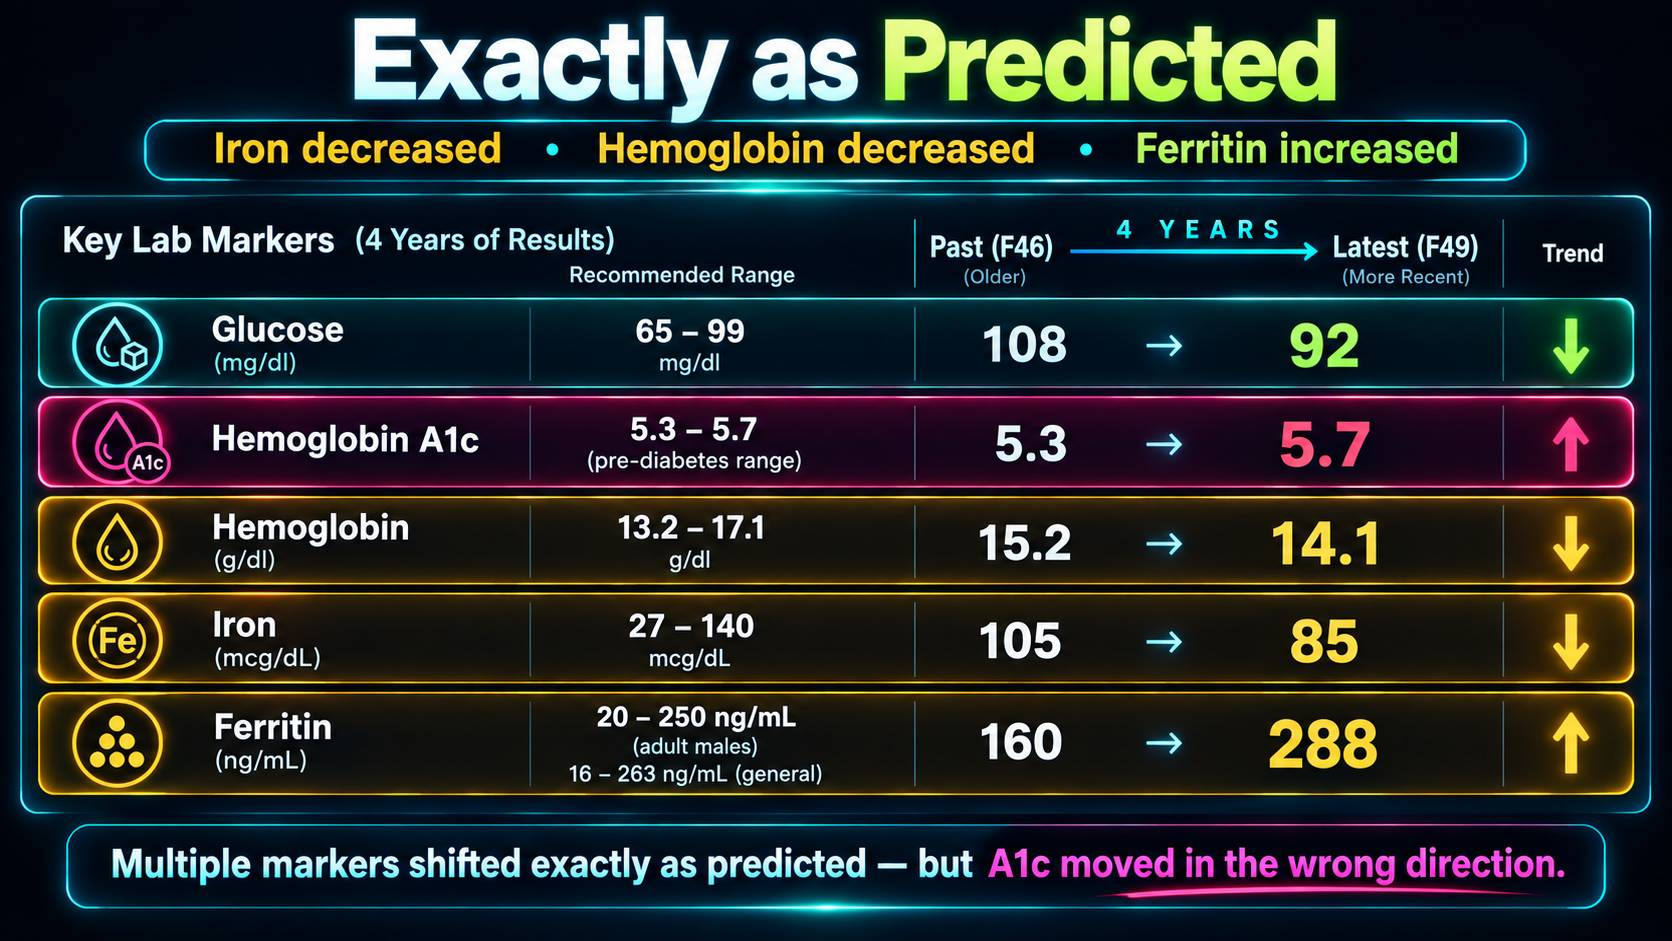
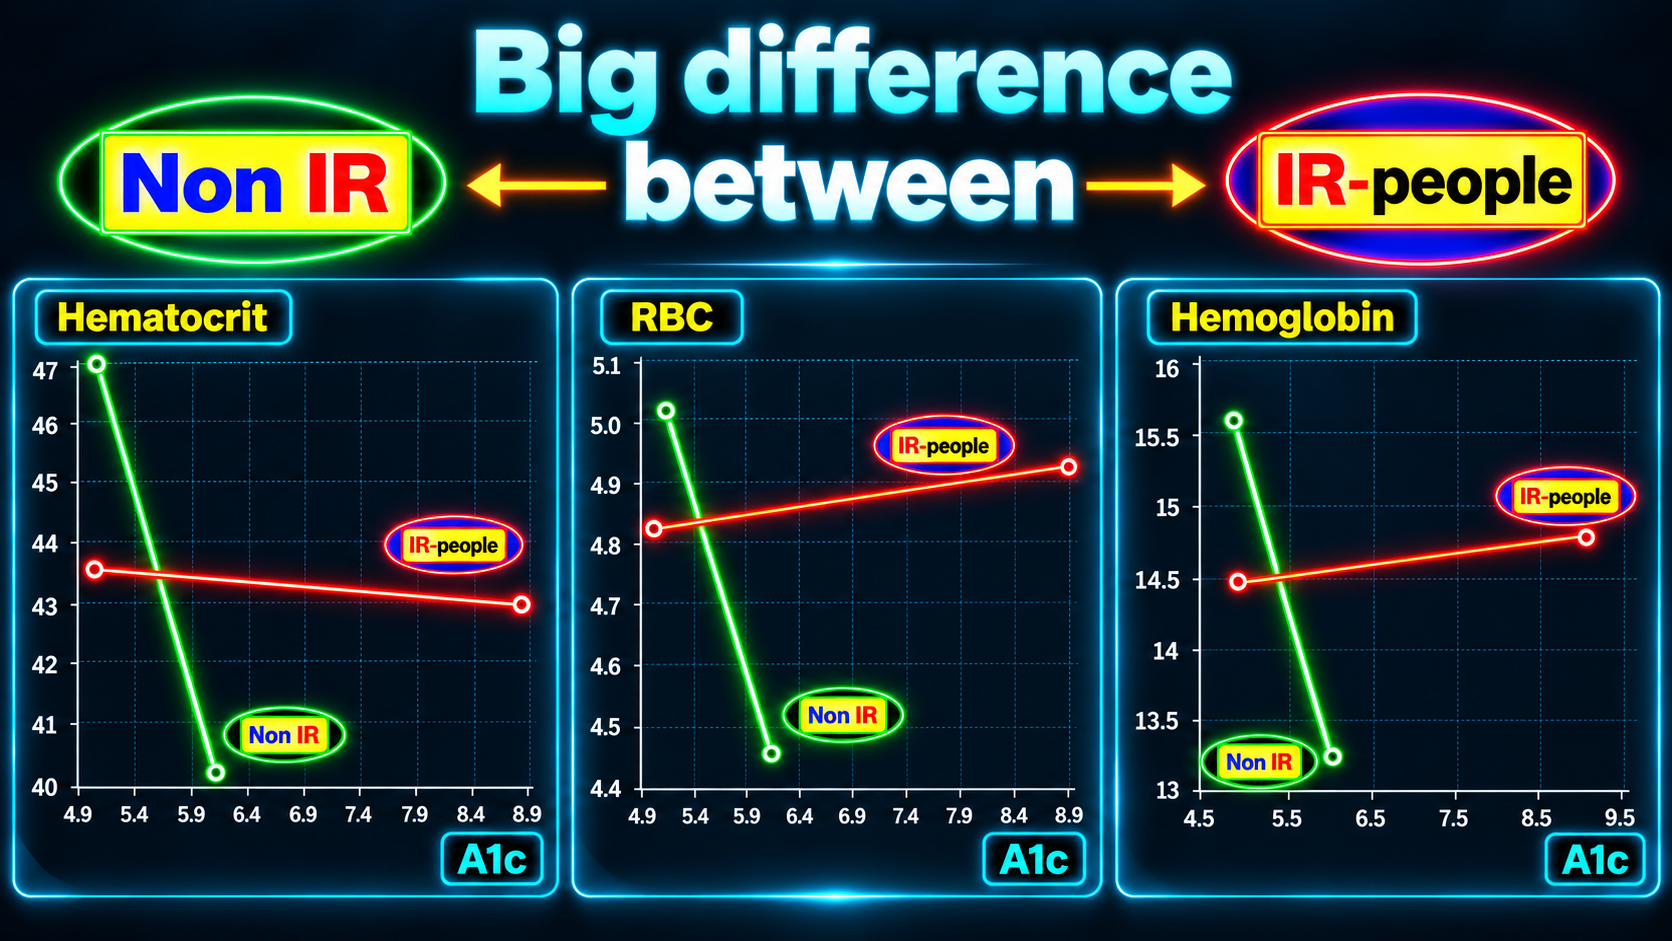
Last time: her insulin, glucose, inflammation and weight all improved over four years, her CGM went flat, and her A1c went up to 5.7 and parked at the prediabetes line. Here is what A1c actually is, because almost nobody is told. A1c is not a glucose test. It is the percentage of your hemoglobin that has glucose stuck to it. Hemoglobin lives inside red blood cells. Glucose attaches slowly and it does not come off. So the number depends on two things, not one: how much glucose is in your blood, and how long your red cells stay in circulation collecting it. Textbooks say a red cell lives about 120 days. That average hides a great deal. Longer-lived cells spend more time in the glucose bath and pick up more of it. Two people with identical glucose can post different A1c values for no reason other than how long their red cells last. That is not my theory. According to PubMed, a 2023 review in Diabetes Technology and Therapeutics states plainly that A1c “is known to be subject to distortions related to altered red blood cell properties, including changes in cellular lifespan,” and that the common case is not disease but ordinary person-to-person variation, large enough “to alter clinical interpretation of HbA1c.” https://doi.org/10.1089/dia.2023.0146 A companion study put numbers on it. In 216 people wearing CGMs, the glycation ratio tracked a red cell lifespan marker, and it ran higher in people over fifty than in people under nineteen. The line I keep coming back to: the variation between individuals inside any one group was at least four times larger than the differences between the groups. https://doi.org/10.1111/dom.14763 Read that again. The person-to-person spread is four times the group-to-group spread. Which means a population reference range for A1c is the wrong instrument for an individual. That is the whole argument I have been making for years, published in a mainstream diabetes journal. Two caveats I will not skip. That study was done in type 1 diabetes and she is not diabetic, and both papers come out of Abbott, who sell continuous glucose monitors and therefore have an interest in A1c looking unreliable. The analysis still holds. You should know who is holding the pen. Now her data. I sorted my whole dataset by insulin resistance and looked at A1c against the red cell markers. In people who are not insulin resistant, rising A1c travels with falling red cell count. Same story in hemoglobin. Same story in hematocrit. Three related measures, one direction. In insulin resistant people that relationship is absent. Fewer red cells, each one in circulation longer, each one carrying more glucose. The A1c rises and the glucose never moved, or as in this case decreased.
I also checked the objection you are forming right now. Iron. Low iron is the textbook reason A1c drifts, and in her four years it does not explain anything: iron and ferritin are flat across both groups, no separation at all.
Her kidney function is normal. Her red cell distribution width did not budge.
And here is what I cannot prove. I cannot measure how long her red cells actually live. That test exists and nobody runs it outside a hospital. What I have is three markers moving together in a direction that fits the mechanism, in one woman, inside a dataset of about forty people. That is a strong candidate, not a settled fact, and I would rather tell you that than pretend otherwise. What I am certain of: a 5.7 A1c in a woman with a fasting insulin of 3.4 and a flat CGM is not prediabetes. It is a measurement artifact wearing a diagnosis. If your A1c has crept up while everything else improved, get your fasting insulin. Not your glucose. Not another A1c. Your fasting insulin. Under 5 is good, over 7 is work to do, and it costs almost nothing to run. The full walkthrough with the plots on screen is the next video. |
Free
Three numbers your doctor called normal
Four pages on three pairs of numbers you have almost certainly had run already: glucose with insulin, triglycerides with HDL, homocysteine with B12 and folate. Read one at a time, each one comes back normal. Read as pairs, they say something else.
Or if you would rather talk it through, the 20-minute call is free. I will tell you on the call if this is not a fit.
Follow Me


Recent Posts
Archives
- September 2026
- August 2026
- July 2026
- June 2026
- May 2026
- April 2026
- March 2026
- February 2026
- January 2026
- December 2025
- November 2025
- October 2025
- September 2025
- August 2025
- July 2025
- June 2025
- May 2025
- April 2025
- March 2025
- February 2025
- January 2025
- December 2024
- November 2024
- October 2024
- September 2024
- August 2024
- July 2024
- June 2024
- May 2024
- April 2024
- March 2024
- February 2024
- January 2024
- December 2023
- November 2023
- October 2023
- September 2023
- August 2023
- July 2023
- June 2023
- May 2023
- April 2023
- March 2023
- February 2023
- January 2023
- December 2022
- November 2022
- October 2022
- September 2022
- August 2022
- July 2022
- June 2022
- May 2022
- April 2022
- March 2022
- February 2022
- January 2022
- December 2021
- November 2021
- October 2021
- September 2021
- August 2021
- July 2021
- June 2021
- May 2021
- April 2021
- March 2021
- February 2021
- January 2021
- December 2020
- November 2020
- October 2020
- September 2020
- August 2020
- July 2020
- June 2020
- May 2020
- April 2020
- March 2020
- February 2020
- January 2020
- December 2019
- November 2019
- October 2019
- September 2019
- August 2019
- July 2019
- June 2019
- May 2019
- April 2019
- March 2019
- February 2019
- January 2019
- December 2018
- November 2018
- October 2018
- September 2018
- August 2018
- July 2018
- June 2018
- May 2018
- April 2018
- March 2018