
I sort my entire dataset by one number
|
Hey Reader, Dr Karl here. Here is the thing almost nobody does, and it is the reason this work looks different from everything else you have seen. I take every client I have ever worked with, every lab, twelve years of it. Each person becomes a row. Each lab becomes a variable. Then I split the whole thing in half using HOMA-IR, which is a formula use to calculate Insulin-Resistance built from fasting insulin and fasting glucose. My cutoff is 1.4. Above are people who are IR, below that they are Non IR.
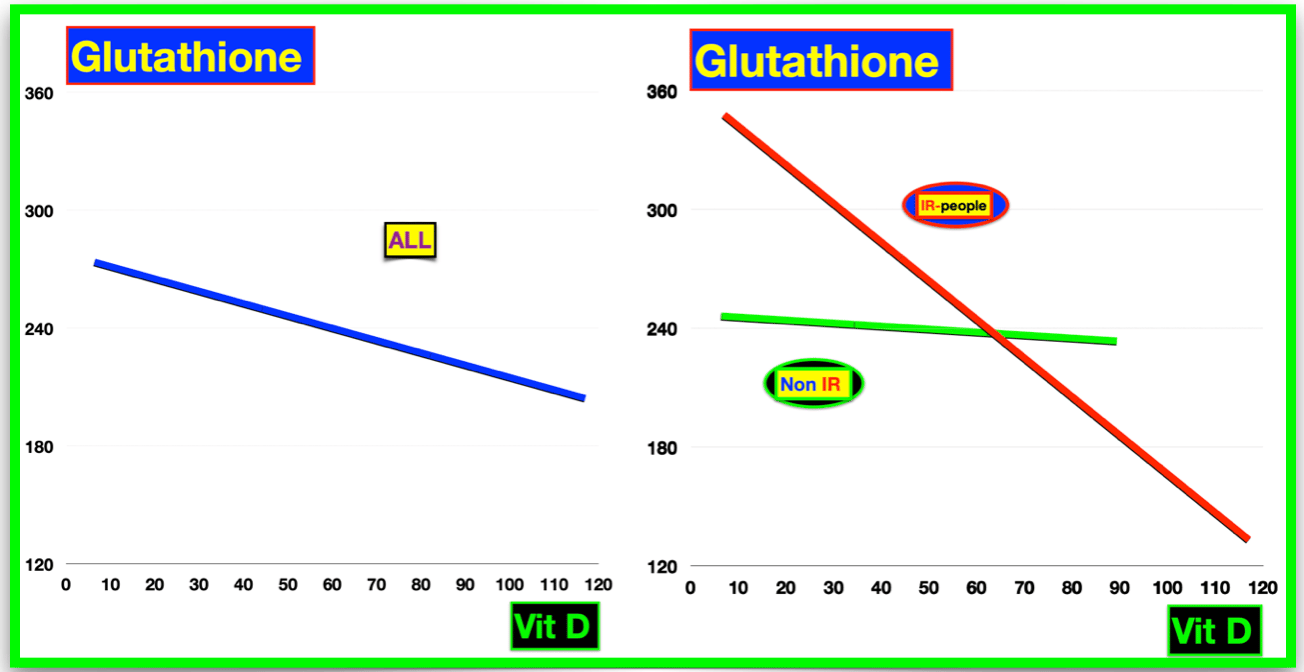
Then I plot any two labs against each other. Say glutathione against vitamin D. Nobody pairs those. They are tightly linked in the liver. Plot them across everyone and you get one line. Now split that line by insulin resistance and you do not get one line sitting higher and one sitting lower.
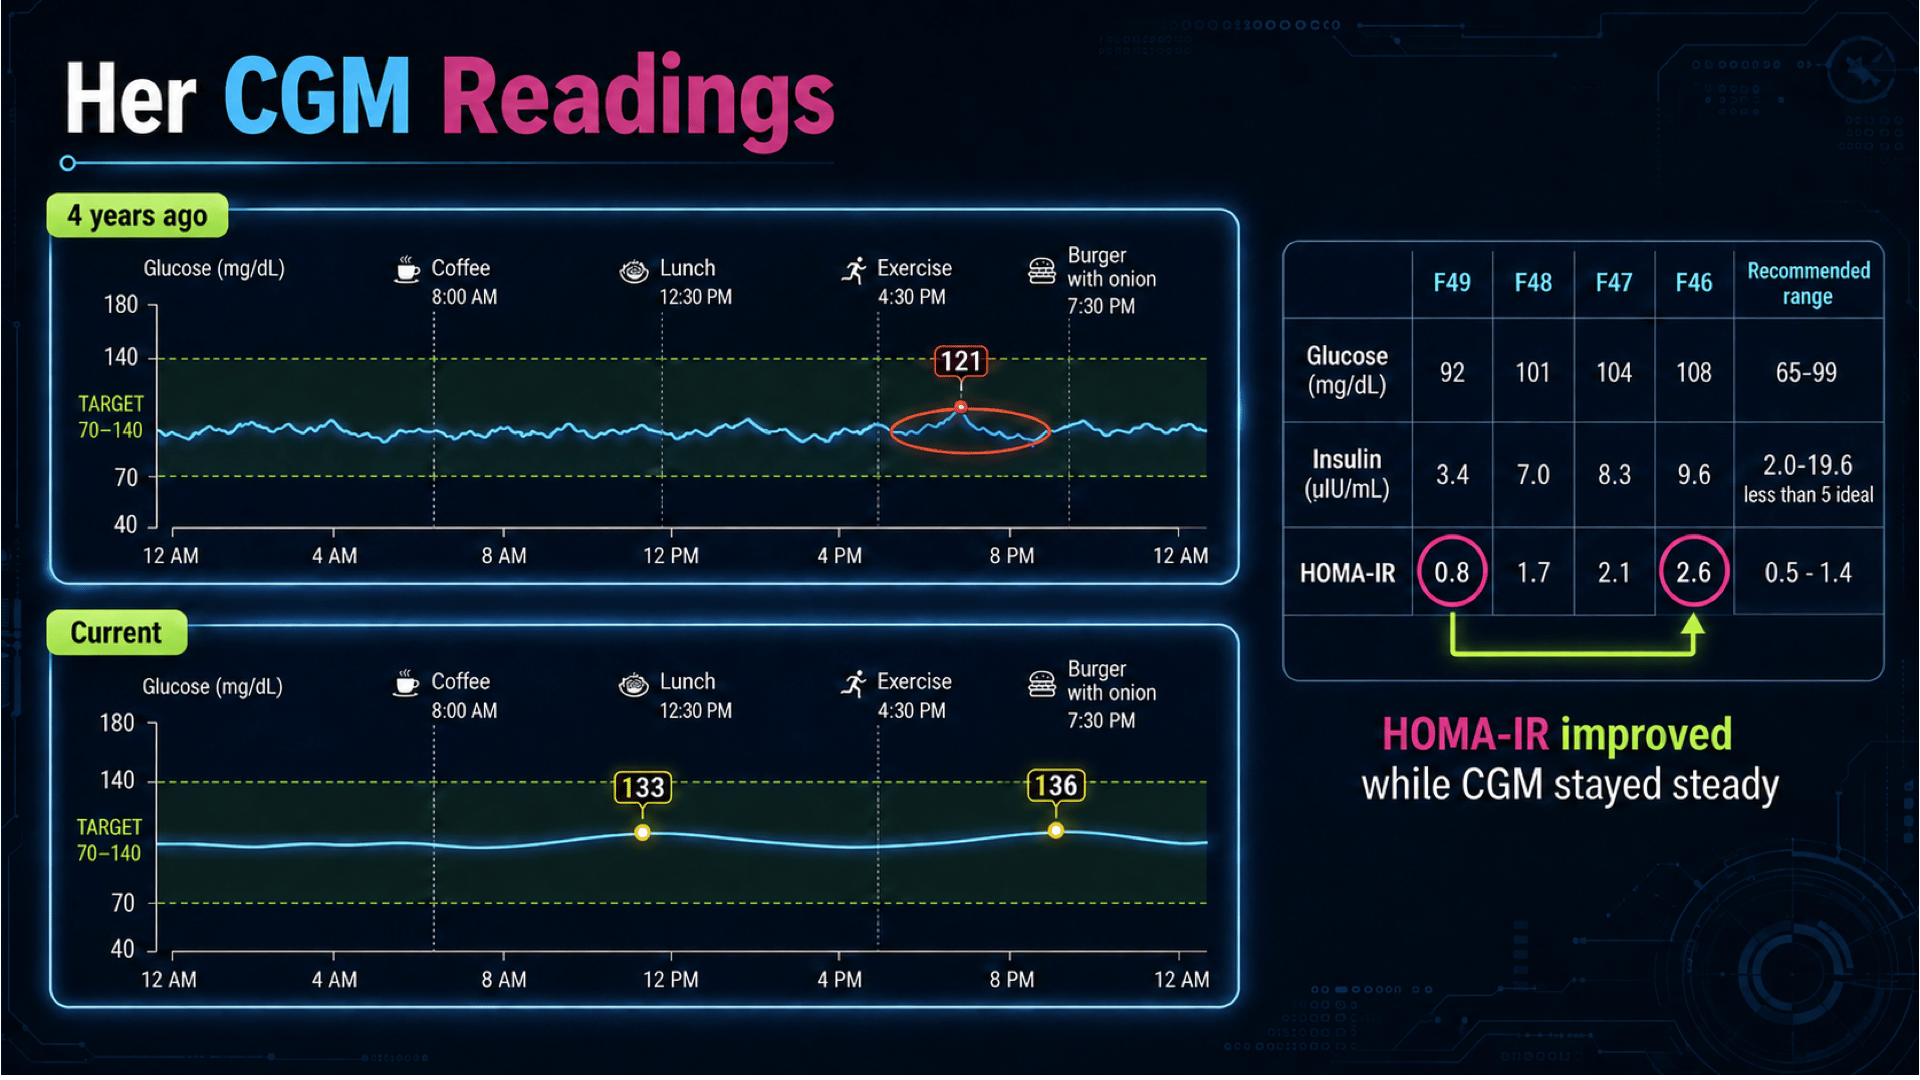
You get two different patterns. Different shapes. Different directions. That is what pattern recognition means, and it is the whole method. Any doctor could do this. The labs are ordinary meaning anyone can order these. Almost nobody does it, because the reimbursement code for “analyze this person’s data against a cohort” does not exist. Your doctor is not lazy. Your doctor is boxed in. Her HOMA-IR ran 2.6, then 2.1, then 1.7, then 0.8.
Look at that sequence. Year one it moved half a point. Year two, another four tenths. She did not cross 1.4 until year four. People want the instantaneous result. This is what it actually looks like: three years of work before the number crossed the line. It takes a routine. It takes convincing the body you are serious. Hers came along. The sort, the cutoff and the four-year sequence are in the video starting around six minutes. >> WATCH: To your health, Dr. Goldkamp Links to Our books
Or consider becoming a client
|



Follow Me


Recent Posts
Archives
- September 2026
- August 2026
- July 2026
- June 2026
- May 2026
- April 2026
- March 2026
- February 2026
- January 2026
- December 2025
- November 2025
- October 2025
- September 2025
- August 2025
- July 2025
- June 2025
- May 2025
- April 2025
- March 2025
- February 2025
- January 2025
- December 2024
- November 2024
- October 2024
- September 2024
- August 2024
- July 2024
- June 2024
- May 2024
- April 2024
- March 2024
- February 2024
- January 2024
- December 2023
- November 2023
- October 2023
- September 2023
- August 2023
- July 2023
- June 2023
- May 2023
- April 2023
- March 2023
- February 2023
- January 2023
- December 2022
- November 2022
- October 2022
- September 2022
- August 2022
- July 2022
- June 2022
- May 2022
- April 2022
- March 2022
- February 2022
- January 2022
- December 2021
- November 2021
- October 2021
- September 2021
- August 2021
- July 2021
- June 2021
- May 2021
- April 2021
- March 2021
- February 2021
- January 2021
- December 2020
- November 2020
- October 2020
- September 2020
- August 2020
- July 2020
- June 2020
- May 2020
- April 2020
- March 2020
- February 2020
- January 2020
- December 2019
- November 2019
- October 2019
- September 2019
- August 2019
- July 2019
- June 2019
- May 2019
- April 2019
- March 2019
- February 2019
- January 2019
- December 2018
- November 2018
- October 2018
- September 2018
- August 2018
- July 2018
- June 2018
- May 2018
- April 2018
- March 2018